
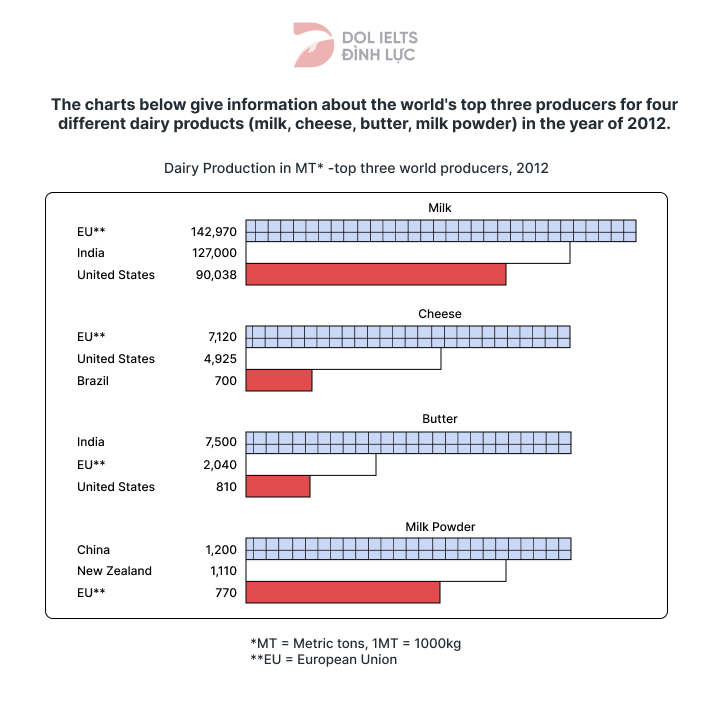
The world's top three producers for four different dairy products in the year of 2012
Đề thi IELTS Writing Task 1 ngày 09/11/2023 dạng Mixed Charts: The charts below give information about the world's top three producers for four different dairy products (milk, cheese, butter, milk powder) in the year of 2012.

🚀 Đề bài
😵 Dàn ý
DOL sẽ miêu tả biểu đồ với 1 câu mở bài (Intro), 1 đoạn miêu tả tổng quát (Overview), và 2 đoạn thân bài miêu tả chi tiết (Detailed Description)
Mở bài: DOL sẽ paraphrase đề bài để giới thiệu lại đề bài cho người chấm
Miêu tả tổng quát: DOL sẽ chỉ ra các đặc điểm quan trọng, nổi bật nhất trong hình
Thân bài:
Body 1: DOL mô tả số liệu của milk và cheese.
Body 2: DOL mô tả số liệu của butter và milk powder.
📝 Bài mẫu
The provided chart compares different countries
Overall, the EU
With nearly 143,000 MT, the EU countries led in milk production. This was closely followed by India and the US, with respective figures
Concerning butter, India manufactured approximately 7,500 MT, nearly
(202 words)
📚 Vocabulary
✨ Bài tập Exercise
Mình cùng làm 2 bài tập sau đây để ôn lại các từ vựng và cấu trúc đã được dùng trong bài Sample IELTS Writing Task 1 nhé!
Exercise 1
-->
market share, Company A has a significant lead over its competitors.
--> China has
in recent years.
-->
for annual revenue were reported by the tech giant.
--> The sales of the new product
our expectations by a significant margin.
--> The company's quarterly profits exceeded expectations by
.
--> The company's stock price is currently
an all-time high.The highest figures
In terms of
a significant margin
emerged as the leading producer of electronics
standing at
exceeded
Exercise 2
Điền các từ/cụm từ phù hợp vào chỗ trống (dựa vào danh sách từ vựng phía trên)
chiếm ưu thế
khoảng
vượt qua
gấp bốn lần
thấp hơn đáng kể
thay đổi một chút
Tổng hợp đề hay tháng 11.2023 có bài mẫu tham khảo.
💡 Lời kết
Tới đây là hết rồi Sau sample The chart below shows the numbers of three types of visitors to a museum between 1997 and 2012, DOL mong các bạn không chỉ nắm được cách trả lời cho dạng bài Mixed Charts, mà còn học được những từ vựng và cấu trúc hay để miêu tả các biểu đồ tương tự nhé.
1. Cấu trúc với while (trong khi): SV. while SV (nói về 2 hành động diễn ra cùng 1 thời điểm).
Ví dụ: The EU emerged as the leading producer of both milk and cheese, while India and China recorded the highest figures for butter and milk powder, respectively.
2. Cách đưa số liệu (data)
- SV, with respective figures standing at [data] and [data]
Lưu ý:
- Tăng/giảm tới: to + [data]
- Tăng giảm thêm: by + [data]
Ví dụ: tăng 10 - 40
--> increase to 40 hoặc increase by 30 (40-10)
Nếu có thời gian thì nhớ làm phần bài tập và tự mình viết một bài khác nha vì 'Practice makes perfect' mà nhỉ? DOL chúc các bạn học tốt!
Bài viết khác
[Quý 2/2025] Đề thi thật IELTS Writing Task 1 – Dạng Map, chủ đề Park changes kèm bài mẫu band 8.5+, dàn ý chi tiết, từ vựng và bài tập ôn luyện.
[Quý 2/2025] Đề thi thật IELTS Writing Task 1 – Dạng Line graph, chủ đề Unemployment trends kèm bài mẫu band 8.5+, dàn ý chi tiết, từ vựng và bài tập ôn luyện.
[Quý 2/2025] Đề thi thật IELTS Writing Task 1 – Dạng Table, chủ đề Medical care comparison kèm bài mẫu band 8.5+, dàn ý chi tiết, từ vựng và bài tập ôn luyện.
[Quý 2/2025] Đề thi thật IELTS Writing Task 1 – Dạng Mixed charts, chủ đề Bottled water consumption kèm bài mẫu band 8.5+, dàn ý chi tiết, từ vựng và bài tập ôn luyện.
[Quý 2/2025] Đề thi thật IELTS Writing Task 1 – Dạng Mixed charts, chủ đề Student spending abroad kèm bài mẫu band 8.5+, dàn ý chi tiết, từ vựng và bài tập ôn luyện.