

Đề thi IELTS Writing Task 1 ngày 28/12/2024 kèm bài mẫu band 8
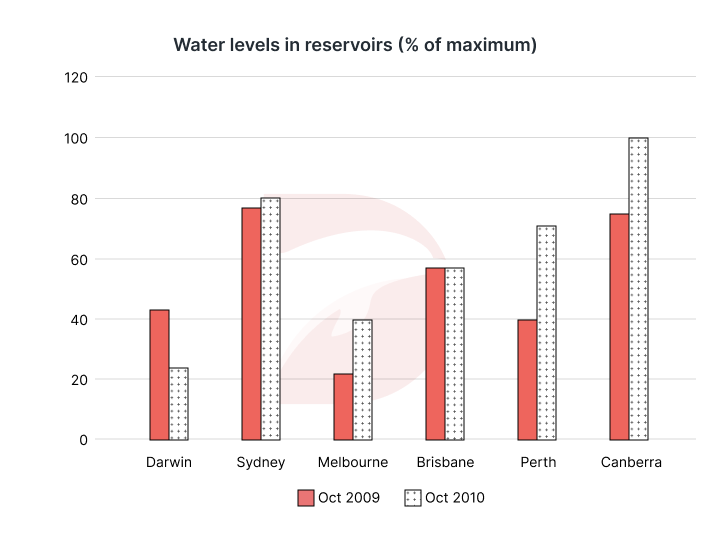
Đề thi IELTS Writing Task 1 ngày 28/12/2024 dạng Bar chart: The chart below shows the water levels of 6 cities in Australia in October 2009 and 2010. Summarize the information by selecting and reporting the main features and make comparisons where relevant.

🚀 Đề bài
😵 Dàn ý
DOL sẽ miêu tả biểu đồ với 1 câu mở bài (Intro), 1 đoạn miêu tả tổng quát (Overview), và 2 đoạn thân bài miêu tả chi tiết (Detailed Description)
Mở bài: DOL sẽ paraphrase đề bài để giới thiệu lại đề bài cho người chấm
Miêu tả tổng quát: DOL sẽ chỉ ra các đặc điểm quan trọng, nổi bật nhất trong biểu đồ.
Thân bài:
Body 1: DOL so sánh mực nước của 6 thành phố ở Úc vào tháng 10 năm 2009.
Body 2: DOL mô tả xu hướng của mực nước ở 6 thành phố vào tháng 10 năm 2010.
📝 Bài mẫu
The presented bar chart illustrates the variations in water levels across six Australian cities during October 2009 and 2010.
Overall, the majority of the surveyed cities
In October 2009, Sydney and Canberra had the most abundant water reserves, with approximately 75% water capacity each. Brisbane, Darwin, and Perth followed,
One year later, Perth witnessed the largest increase in water levels,
(223 words)
📚 Vocabulary
✨ Bài tập Exercise
Mình cùng làm 2 bài tập sau đây để ôn lại các từ vựng và cấu trúc đã được dùng trong bài IELTS Writing Sample Task 1 nhé!
Exercise 1: Điền từ / cụm từ phù hợp để hoàn thành câu sau.
-> Over the past decade, the company has
in its annual revenue.
-> The local government is planning to build a new
to meet the growing demand for water in the city.
-> The sales in 2023 exceeded those of the
, marking a significant growth in the market.
-> Despite fluctuations in the stock market, the value of the company’s shares
last month.
-> The report will
for both the sales performance and customer satisfaction levels in the past quarter.
-> The temperature
of 35°C yesterday, making it the hottest day of the year.witnessed an upward trend
recorded no change
hit a high
reservoir
preceding year
register figures
Exercise 2: Tìm những từ / cụm từ tiếng Anh phù hợp với những từ / cụm từ sau.
đạt đỉnh
trải qua các xu hướng tăng
rõ rệt
gặp phải sự suy giảm đáng kể
vẫn không thay đổi
💡 Lời kết
Tới đây là hết rồi 😍 Sau sample “The chart below shows the water levels of 6 cities in Australia in October 2009 and 2010. Summarize the information by selecting and reporting the main features and make comparisons where relevant.", DOL mong các bạn không chỉ nắm được cách trả lời cho dạng bài Bar chart, mà còn học được những từ vựng và cấu trúc hay để miêu tả các biểu đồ tương tự nhé.
🤩 Mình cùng nhau học lại những cấu trúc hay đươc dùng trong bài nhé!
1. Cách mô tả số liệu trong một khoảng.
- range from ... to ...
Ví dụ: ranging from 40% to approximately 55%
- hover
Ví dụ: hovering around 25%
2. Cấu trúc tương phản
- SV. In contrast, SV
Ví dụ: Brisbane, Darwin, and Perth followed, registering figures ranging from 40% to approximately 55%. In contrast, Melbourne recorded the lowest water percentage in its reservoirs, hovering around 25%.
- Although SV, SV
Ví dụ: Although Sydney and Melbourne also experienced upward trends, their growth was less pronounced,...
- SV. Conversely, SV
Ví dụ: Although Sydney and Melbourne also experienced upward trends, [SV]. Conversely, Darwin encountered a notable decline in its reservoir water, decreasing to just under 30% of its capacity in October 2010.
Nếu có thời gian thì nhớ làm phần bài tập và tự mình viết một bài khác nha vì 'Practice makes perfect' mà nhỉ? DOL chúc các bạn học tốt!
Bài viết khác
[Quý 1] Dự đoán đề IELTS Writing Task 1 – Dạng Bar chart, chủ đề Absenteeism survey results kèm bài mẫu band 8.5+, dàn ý chi tiết, từ vựng và bài tập ôn luyện.
[Quý 1] Dự đoán đề IELTS Writing Task 1 – Dạng Table, chủ đề Tax data in five countries kèm bài mẫu band 8.5+, dàn ý chi tiết, từ vựng và bài tập ôn luyện.
[Quý 1] Dự đoán đề IELTS Writing Task 1 – Dạng Map, chủ đề Changes in city layout kèm bài mẫu band 8.5+, dàn ý chi tiết, từ vựng và bài tập ôn luyện.
[Quý 1] Dự đoán đề IELTS Writing Task 1 – Dạng Bar chart, chủ đề Foreign language learning trends kèm bài mẫu band 8.5+, dàn ý chi tiết, từ vựng và bài tập ôn luyện.
[Quý 1] Dự đoán đề IELTS Writing Task 1 – Dạng Bar chart, chủ đề Citrus fruit export kèm bài mẫu band 8.5+, dàn ý chi tiết, từ vựng và bài tập ôn luyện.