Bài mẫu IELTS Writing Task 1 band 8 ngày 08/06/2024
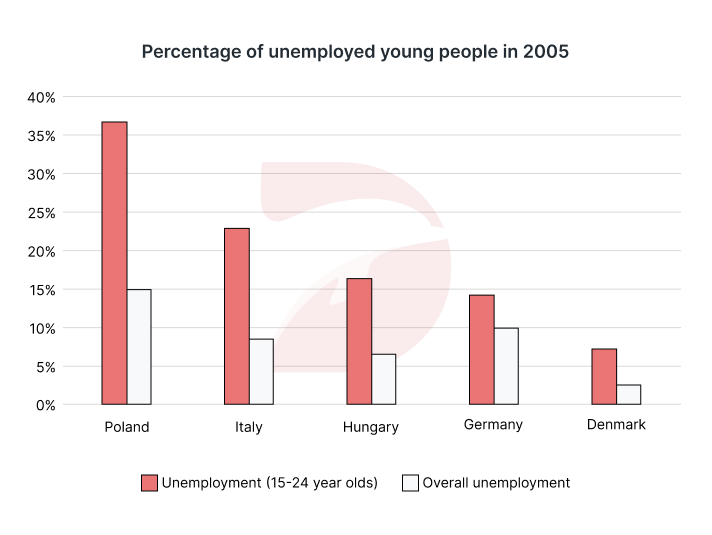
Đề thi IELTS Writing Task 1 ngày 08/06/2024 dạng Bar chart: The chart below shows the percentage of unemployed people aged between 15 and 24 in five European countries in 2005, compared with the overall percentage of unemployment in those countries. Summarise the information by selecting and reporting the main features, and make comparisons where relevant.
🚀 Đề bài

😵 Dàn ý
DOL sẽ miêu tả biểu đồ với 1 câu mở bài (Intro), 1 đoạn miêu tả tổng quát (Overview), và 2 đoạn thân bài miêu tả chi tiết (Detailed Description)
Mở bài: DOL sẽ paraphrase đề bài để giới thiệu lại đề bài cho người chấm.
Miêu tả tổng quát: DOL sẽ chỉ ra các đặc điểm quan trọng, nổi bật nhất trong biểu đồ.
Thân bài:
Body 1: DOL so sánh phần trăm người thất nghiệp 15-24 tuổi và tỷ lệ thất nghiệp chung ở 3 quốc gia Poland, Italy và Hungary.
Body 2: DOL so sánh phần trăm người thất nghiệp 15-24 tuổi và tỷ lệ thất nghiệp chung ở 2 quốc gia còn lại Germany và Denmark.
- The 15-24 age bracket (35%) ~ 2x the total population;
- Both were the highest.
- 15-24-year-olds: ranged from 18% to 24%;
- The overall: around 8%.
- 15-24 (<15%); exceeded the overall rate by about 5%;
- The total population: 3%;
- 15-24: 7%
📝 Bài mẫu
The given bar chart compares five different countries in terms of the proportion of
Overall, it is notable from the chart that Poland
In Poland, over 35% of individuals in the 15-24
Germany showed that just under 15% of those aged 15-24 were unemployed, which
(187 words)
📚 Vocabulary
✨ Bài tập Exercise
Mình cùng làm 2 bài tập sau đây để ôn lại các từ vựng và cấu trúc đã được dùng trong bài IELTS Writing Sample Task 1 nhé!
Exercise 1: Điền từ / cụm từ phù hợp để hoàn thành câu sau.
1 Nhiều người đang phải vật lộn để tìm việc làm trong điều kiện kinh tế hiện nay, dẫn đến số lượng người thất nghiệp ngày càng tăng.
-> Many people are struggling to find work in the current economic climate, leading to a rise in the number of
individuals.
2 Các nhà khoa học sẽ ghi nhận lại kết quả thí nghiệm trong một báo cáo chi tiết.
-> Scientists will
the experiment's results in a detailed report.
3 Nền kinh tế đang trải qua sự tăng trưởng nhanh chóng, được thúc đẩy bởi sự gia tăng chi tiêu của người tiêu dùng.
-> The economy is
rapid growth, driven by increased consumer spending.
4 Cuộc khảo sát đã phân tích dữ liệu từ các độ tuổi khác nhau để hiểu sở thích của người tiêu dùng.
-> The survey analyzed data from different
to understand consumer preferences.
5 Cả hai thành phố đều có xu hướng tương tự về tăng trưởng dân số và phát triển cơ sở hạ tầng.
-> Both cities
in population growth and infrastructure development.age brackets
experiencing
jobless
display similar trends
record
Exercise 2: Tìm những từ / cụm từ tiếng Anh phù hợp với những từ / cụm từ sau.
mặc dù
sự chênh lệch
khoảng
vượt quá
💡 Lời kết
Tới đây là hết rồi 😍 Sau sample “The chart below shows the percentage of unemployed people aged between 15 and 24 in five European countries in 2005, compared with the overall percentage of unemployment in those countries. Summarise the information by selecting and reporting the main features, and make comparisons where relevant.", DOL mong các bạn không chỉ nắm được cách trả lời cho dạng bài Bar chart, mà còn học được những từ vựng và cấu trúc hay để miêu tả các biểu đồ tương tự nhé.
Mình cùng nhau học lại những cấu trúc hay đươc dùng trong bài nhé!
1 It is notable from the chart that Poland recorded the highest unemployment rates, while Denmark experienced the lowest.
-> Cấu trúc It is notable được dùng để đưa ra một điểm quan trọng.
-> cấu trúc SV, while SV --> while dùng để nối 2 mệnh đề có thông tin trái ngược nhau.
2 In Poland, over 35% of individuals in the 15-24 age bracket were jobless, more than double the figure for the total population, both of which were by far the highest among the five countries.
-> Cấu trúc so sánh more than double để so sánh tỷ lệ thất nghiệp, và dùng by far để nhấn mạnh mức độ cao nhất trong số các quốc gia.
3 Italy and Hungary displayed similar trends, albeit with smaller disparities between the two rates.
-> "albeit with" được sử dụng để thêm thông tin bổ sung mang nét nghĩa trái ngược với thông tin trước đó.
4 Germany showed that just under 15% of those aged 15-24 were unemployed, which exceeded the overall rate by about 5%
-> Câu này dùng mệnh đề quan hệ với "which" để bổ sung thông tin so sánh 2 tỷ lệ.
5 Meanwhile, Denmark had the lowest figures, with only 3% of the total population facing unemployment...
-> Cấu trúc "Meanwhile" để chuyển đoạn và so sánh.
Nếu có thời gian thì nhớ làm phần bài tập và tự mình viết một bài khác nha vì 'Practice makes perfect' mà nhỉ? DOL chúc các bạn học tốt! 🥳


