Bài mẫu IELTS Writing Task 1 band 8 ngày 25/05/2024
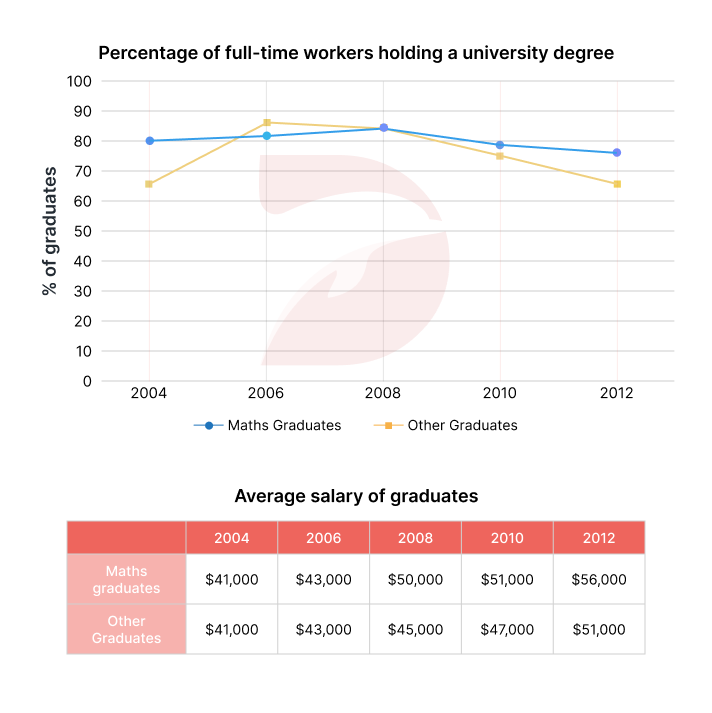
Đề thi IELTS Writing Task 1 ngày 25/05/2024 dạng Mixed charts: The graphs below show the percentage of math graduates and other graduates who got full-time job after graduating from a university in Australia, and also show the average salary of both these types of graduates, from 2004 to 2012. Summarise the information by selecting and reporting the main features, and make comparisons where relevant.

🚀 Đề bài
😵 Dàn ý
DOL sẽ miêu tả biểu đồ với 1 câu mở bài (Intro), 1 đoạn miêu tả tổng quát (Overview), và 2 đoạn thân bài miêu tả chi tiết (Detailed Description)
Mở bài: DOL sẽ paraphrase đề bài để giới thiệu lại đề bài cho người chấm.
Miêu tả tổng quát: DOL sẽ chỉ ra các đặc điểm quan trọng, nổi bật nhất trong biểu đồ.
Thân bài:
Body 1: DOL mô tả tỷ lệ việc làm của sinh viên tốt nghiệp ngành toán và các chuyên ngành khác (line graph).
Body 2: DOL mô tả mức lương trung bình của họ (table).
- Math graduates > other graduates (in 2004 & 2012)
- Math graduates > their counterparts (over the last 4 years)
- Math graduates: increased (80% in 2004 >> peak of 85% in 2008 >> declining to ~ 78% in 2012);
- Other graduates: the same pattern (peaking at ~ 87% in 2006 >> dropping to 65% in 2012).
- Both groups started with the same ($41000);
- Math degrees: sharp growth >> ending with $56000;
- Other graduates: similar trend >< less pronounced ($51000 in 2012.)
📝 Bài mẫu
The graphs
Overall, the percentage of math graduates and other graduates who were able to find employment
Regarding the employment rate, the figure for math graduates
Concerning their average salaries, both groups started with the same amount of $41000 in 2004. The wage of full-time workers with math degrees then
(208 words)
📚 Vocabulary


✨ Bài tập Exercise
Mình cùng làm 2 bài tập sau đây để ôn lại các từ vựng và cấu trúc đã được dùng trong bài IELTS Writing Sample Task 1 nhé!
Exercise 1: Điền từ / cụm từ phù hợp để hoàn thành câu sau.
1 Giáo viên dùng đồ thị để minh họa sự thay đổi nhiệt độ trong năm qua.
-> The teacher used a graph to
2 Giá cổ phiếu biến động với xu hướng giảm trong sáu tháng qua.
-> The stock prices
3 Số lượng người tham gia vượt quá sự mong đợi của chúng tôi.
-> The number of participants
4 Lợi nhuận của công ty tăng nhẹ trong quý 3.
-> The company's profits
5 Số liệu bán hàng giảm vừa phải sau kỳ nghỉ lễ.
-> Sales figures
6 Doanh số bán sản phẩm mới có mô hình tương tự như sản phẩm tiền nhiệm của nó.
-> The sales of the new product
Exercise 2: Tìm những từ / cụm từ tiếng Anh phù hợp với những từ / cụm từ sau.
đạt đỉnh
khoảng
giảm xuống mức thấp
ghi nhận mức tăng trưởng mạnh
có một xu hướng tương tự
rõ rệt
💡 Lời kết
Tới đây là hết rồi 😍 Sau sample “The graphs below show the percentage of math graduates and other graduates who got full-time job after graduating from a university in Australia, and also show the average salary of both these types of graduates, from 2004 to 2012. Summarise the information by selecting and reporting the main features, and make comparisons where relevant.", DOL mong các bạn không chỉ nắm được cách trả lời cho dạng bài Mixed chart, mà còn học được những từ vựng và cấu trúc hay để miêu tả các biểu đồ tương tự nhé.
 Mình cùng nhau học lại những cấu trúc hay đươc dùng trong bài nhé!
1. Sử dụng đa dạng các câu phức
Ví dụ 1: The percentage of math graduates and other graduates who were able to find employment fluctuated with a downward trend, with the former exceeding the latter both at the start and the end of the period.
-> Phân tích cấu trúc câu phức: gồm mệnh đề chính + cụm giới từ bổ sung thông tin
- Mệnh đề chính: The percentage of math graduates and other graduates who were able to find employment fluctuated with a downward trend.
Trong đó:
Chủ ngữ: The percentage of math graduates and other graduates who were able to find employment.
Động từ: fluctuated.
Bổ ngữ: with a downward trend.
- Cụm giới từ bổ sung thông tin: with the former exceeding the latter both at the start and the end of the period.
Ví dụ 2: The figure for math graduates increased slightly from 80% in 2004 to a peak of 85% in 2008 before declining moderately to around 78% in 2012.
-> Cấu trúc: SV before + V-ing (diễn tả một hành động xảy ra trước một hành động khác)
2. Các cấu trúc tương phản
- While SV, SV
Ví dụ: While the salaries for both types generally increased, math graduates earned more than their counterparts.
- SV, V-ing 1 but V-ing 2
Ví dụ: Other graduates mirrored the same pattern, peaking at roughly 87% in 2006 but then dropping to a low of 65% at the end of the surveyed period.
Nếu có thời gian thì nhớ làm phần bài tập và tự mình viết một bài khác nha vì 'Practice makes perfect' mà nhỉ? DOL chúc các bạn học tốt! 🥳
Bài viết khác
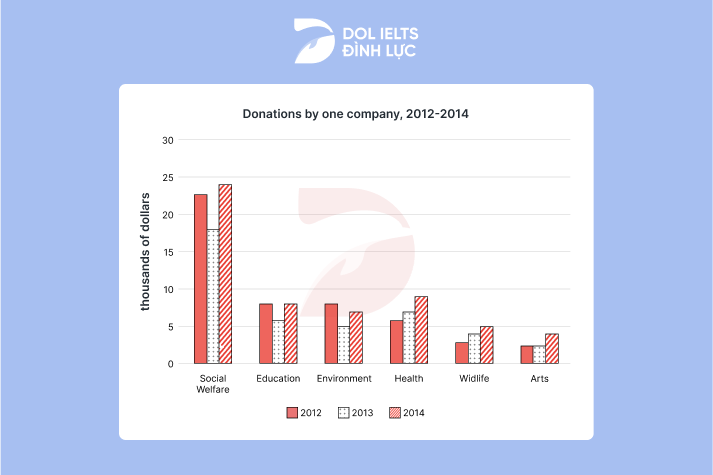
Đề thi IELTS Writing Task 1 ngày 04/01/2025 dạng Bar chart: The chart below shows the donation given to six different types of charity by one company from 2012 to 2014. Summarize the information by selecting and reporting the main features and make comparisons where relevant.
Đề thi IELTS Writing Task 1 ngày 11/01/2025 dạng Map: The maps below show the changes in a library from 1975 to the present. Summarize the information by selecting and reporting the main features, and make comparisons where relevant.

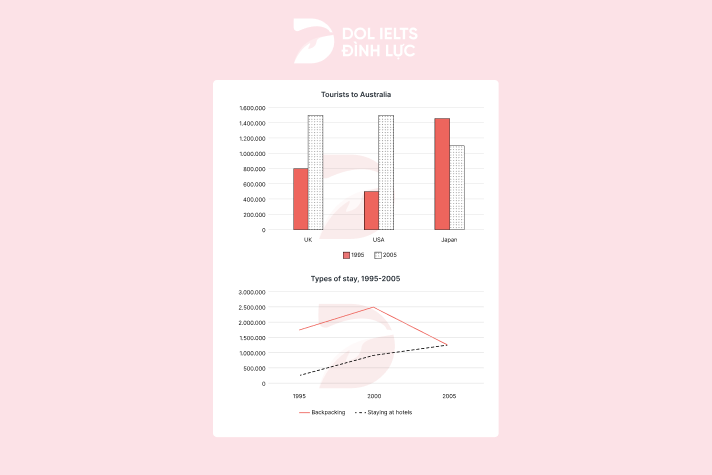
Đề thi IELTS Writing Task 1 ngày 18/01/2025 dạng Mixed chart: The bar chart below shows how tourism to Australia from three different countries changed between 1995 and 2005. The line chart illustrates the types of stay that tourists chose during the same period.
Đề thi IELTS Writing Task 1 ngày 16/11/2024 dạng Pie chart: The charts below show the percentage of students on an adult education center taking various courses offered in 1985 and this year. Summarize the information by selecting and reporting the main features, and make comparisons where relevant.
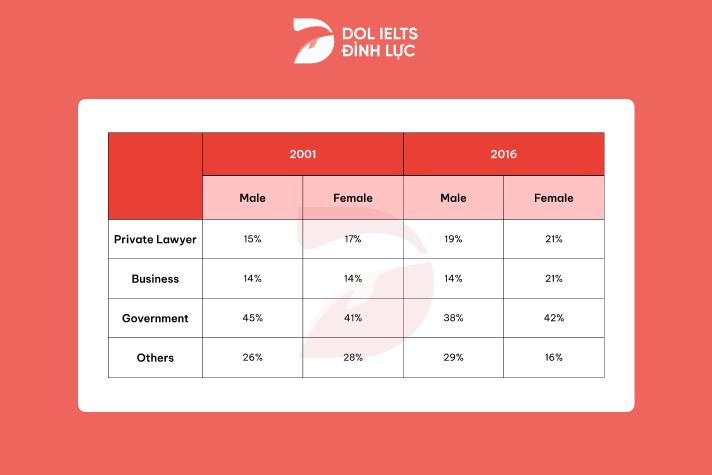
Đề thi IELTS Writing Task 1 ngày 16/01/2025 dạng Table: The table below shows the changes in the percentage of lawyers choosing jobs in different industries in a specific country from 2001 to 2016. Summarize the information by selecting and reporting the main features, and make comparisons where relevant.