
Bar chart: Percentage of the total world population - IELTS Writing Task 1
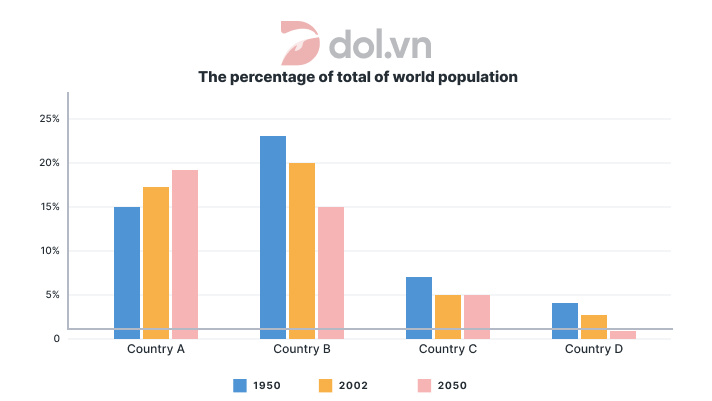
Đề thi IELTS Writing Task 1 ngày 25/08/2018 dạng Bar chart: The bar chart shows the percentage of the total world population in 4 countries in 1950 and 2003, and projections for 2050. Ở bài viết này DOL sẽ viết 1 sample IELTS Writing được 8.0 kèm với 1 số từ vựng và cấu trúc hay trong bài. Chúc các bạn học IELTS vui vẻ cùng dol.vn.

🚀 Đề bài
😵 Dàn ý
DOL sẽ miêu tả biểu đồ với một câu mở bài (Intro) kèm phần miêu tả tổng quát (Overview), và 2 đoạn thân bài miêu tả chi tiết (Detailed Description)
Mở bài: DOL sẽ paraphrase lại đề bài để giới thiệu lại đề bài cho người chấm, sau đó viết phần Overview để miêu tả các chi tiết quan trọng, nổi bật nhất trong biểu đồ.
Thân bài: Vì đây là dạng bài có số liệu thay đổi theo các năm, ta sẽ tập trung vào xu hướng tăng giảm của các số liệu
Body 1: Vì số liệu của India & China khác hẳn so với USA& Japan, ta sẽ chia chúng làm 2 và lần lượt phân tích ở từng đoạn thân bài. Ở đoạn này, DOL sẽ phân tích xu hướng của India & China
Body 2: Tiếp đến, DOL sẽ mô tả số liệu và xu hướng của từng các quốc gia còn lại
- Making up close to a quarter of the world’s population → China was the most populated country out of the 4
- India came in second at 15 percent
- The USA and Japan, at around 7 and 4.5 percent respectively
- China’s share of the world’s population fell steadily, and is expected to fall below India’s - in 2002
- India’s population grew to 15% of the world population.
- It is projected that China’s share of the world's total inhabitants would again fall to 15%, while India would usurp it at around 18 percent
- The US population in 2002 was 5% of the world’s total → remain the same by 2050
- The population of Japan is expected to fall from 3 percent to 1 percent by mid-century.
📝 Bài mẫu
The bar chart gives information on the
Starting in the 1950s, China was by far
Meanwhile, the US’ population in 2002 was 5% of the world’s total, and this is expected to
(220 words)
📚 Vocabulary
Danh sách từ vựng cần thiết áp dụng trong bài mẫu IELTS Writing vừa rồi.


✨ Bài tập Exercise
Mình cùng làm 2 bài tập sau đây để ôn lại các từ vựng và cấu trúc đã được dùng trong bài viết mẫu Writing Task 1 nhé!
Exercise 1:
When the figure for A increases and exceeds that for B, we can say that it
When the figure for A witnesses neither an increase nor decrease, we can say that it
If the figure for A decreases slowly and at a similar rate, we can say that it
When the figure for A decreases after it has already been minor or has just dropped substantially, we can say that it
Exercise 2:
1 Trung Quốc giữ phần chia lớn nhất trong tổng dân số thế giới.
=> China
2 Số liệu của Nhật tăng mạnh mẽ vào năm 1999.
=> The figure for Japan
3 Ta có thể thấy Ấn Độ được dự đoán là sẽ vượt qua Trung Quốc vào năm 2050.
=> It can be seen that India
4 Ấn Độ là quốc gia đông dân thứ hai trên thế giới.
=> India ranks second in terms of
5 Sau khi tăng tới 40%, con số đã giảm từ từ vào những năm tiếp theo.
=> After surging to 40%, the figure experienced steady falls
6 Dân số Trung Quốc chiếm 1/4 dân số trên thế giới
=> China's population
7 Nhưng theo báo cáo tin tức, hơn một nửa số nhà máy than của nước này được dự kiến sẽ hết nhiên liệu trong một hoặc hai ngày tới.
=> But according to news reports, more than half of the country’s coal plants
8 Dân số thế giới được tính đã đạt 7.9 tỷ người
=> The
💡 Lời kết
Tới đây là hết rồi  Sau sample "The bar chart shows the percentage of the total world population in 4 countries in 1950 and 2003, and projections for 2050" vừa rồi, DOL mong các bạn không chỉ nắm được cách trả lời cho dạng bài Bar chart, mà còn học được những từ vựng và cấu trúc hay để miêu tả các biểu đồ tương tự nhé.
Nếu có thời gian thì nhớ làm phần bài tập và tự mình viết một bài khác nha vì 'Practice makes perfect' mà nhỉ? DOL chúc các bạn học tốt! 
Bài viết khác
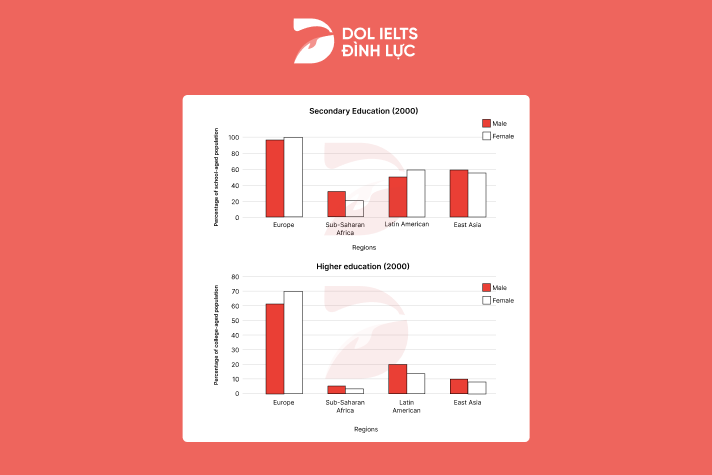
Đề thi IELTS Writing Task 1 ngày 22/02/2025 dạng Bar chart: The first chart below shows the percentage of school-aged girls and boys who were at secondary school in four regions of the world in 2000. The second chart shows the percentages of college-aged men and women in higher education in the same year.
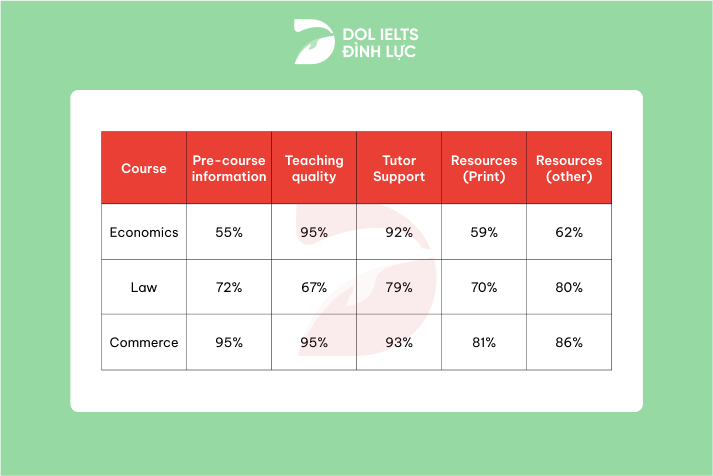
Đề thi IELTS Writing Task 1 ngày 13/02/2025 dạng Table The table below the results of a survey of first-year students taking various courses at a particular university. It shows how many of the students considered various aspects of their course 'very good'.
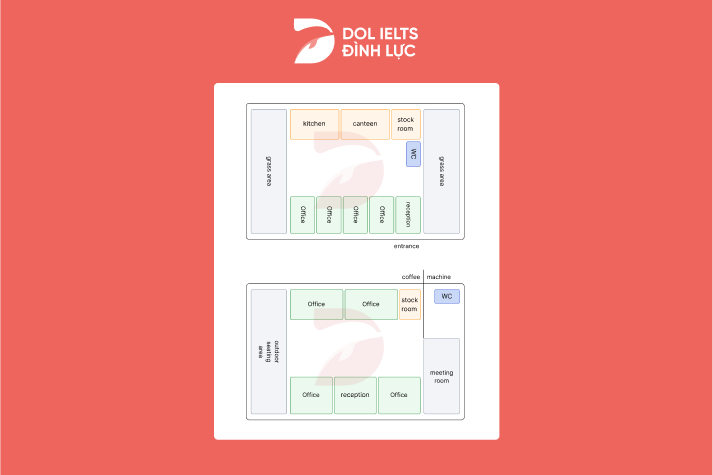
Đề thi IELTS Writing Task 1 ngày 21/12/2024 dạng Map: The diagram below shows what an office building looks at present and plans on future development. Summarize the information by selecting and reporting the main features and make comparisons where relevant.
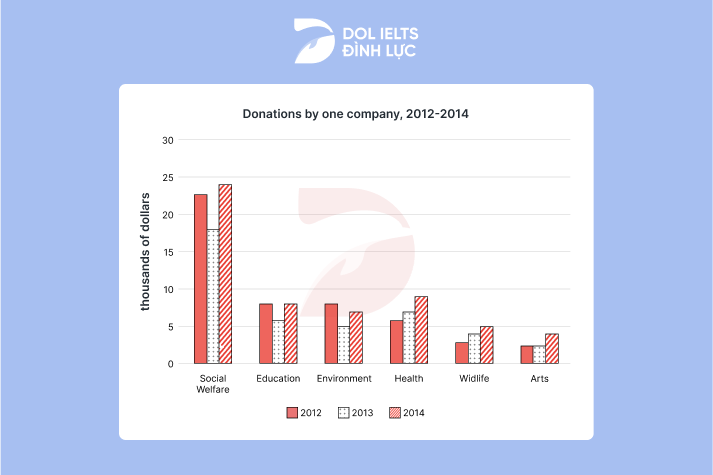
Đề thi IELTS Writing Task 1 ngày 04/01/2025 dạng Bar chart: The chart below shows the donation given to six different types of charity by one company from 2012 to 2014. Summarize the information by selecting and reporting the main features and make comparisons where relevant.
Đề thi IELTS Writing Task 1 ngày 11/01/2025 dạng Map: The maps below show the changes in a library from 1975 to the present. Summarize the information by selecting and reporting the main features, and make comparisons where relevant.