Đề thi IELTS Writing Task 1 ngày 17/02/2024 kèm bài mẫu band 8
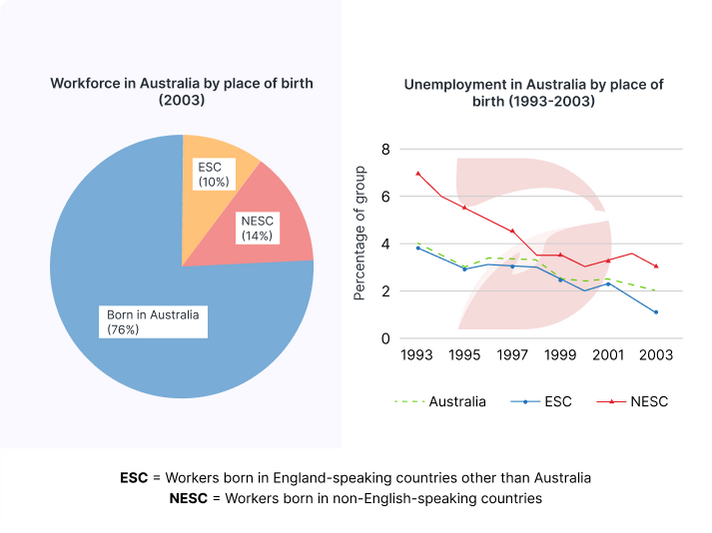
Đề thi IELTS Writing Task 1 ngày 17/02/2024 dạng Mixed Charts: The chart and graph below give information about three categories of workers in Australia and the unemployment levels within those groups. Summarise the information by selecting and reporting the main features, and make comparisons where relevant.
🚀 Đề bài

😵 Dàn ý
DOL sẽ miêu tả biểu đồ với 1 câu mở bài (Intro), 1 đoạn miêu tả tổng quát (Overview), và 2 đoạn thân bài miêu tả chi tiết (Detailed Description)
Mở bài: DOL sẽ paraphrase đề bài để giới thiệu lại đề bài cho người chấm.
Miêu tả tổng quát: DOL sẽ chỉ ra các đặc điểm quan trọng, nổi bật nhất trong biểu đồ.
Thân bài:
Body 1: DOL mô tả phần trăm về 3 kiểu người lao động ở Úc (Pie chart)
Body 2: DOL mô tả mức độ thất nghiệp trong các nhóm đó (Line graph)
📝 Bài mẫu
The pie chart illustrates the proportion of three different groups of workers in Australia in the year of 2003 while the line chart shows the changes in their unemployment rates from 1993 to 2003.
Overall, Australia-born workers represented the largest
(179 words)
📚 Vocabulary
✨ Bài tập Exercise
Mình cùng làm 2 bài tập sau đây để ôn lại các từ vựng và cấu trúc đã được dùng trong bài Sample IELTS Writing Task 1 nhé!
Exercise 1:
-> The
of students who passed the exam increased significantly this year.
-> She bought a new car.
, she got a promotion at work.
-> The stock market has
in recent months.
-> Despite the competition, their sales figures
in the industry.
->
your inquiry about the project, we will provide an update soon.
->
of customers prefer the new design.witnessed a downward trend
proportion
Regarding
In addition
The vast majority
remain the highest
Giải bài mẫu IELTS Writing Task 2 ngày 17/02/2024 và từ vựng kèm theo!
Exercise 2:
Điền từ vào chỗ trống (dựa vào những gợi ý có sẳn)
liên quan đến
biến động theo xu hướng giảm
theo một xu hướng tương tự
mức độ tương ứng
giảm
Tổng hợp đề thi thật tháng 02.2024 có bài mẫu tham khảo.
💡 Lời kết
Tới đây là hết rồi Sau sample The graph below shows the percentage of Australian export to four countries from 1990 to 2012. Summarise the information by selecting and reporting the main features, and make comparisons where relevant, DOL mong các bạn không chỉ nắm được cách trả lời cho dạng bài Line graph, mà còn học được những từ vựng và cấu trúc hay để miêu tả các biểu đồ tương tự nhé.
1. Cấu trúc so sánh nhất với tính từ ngắn:
Công thức: SV + the + Adj_est + Noun
Ví dụ: Australia-born workers represented the largest proportion in the total workforce of Australia.
2. Sử dụng cấu trúc câu phức
Ví dụ: Far fewer were those originating from countries that do not speak English (NESC), at 14%, which was slightly higher than the figure for workers from English-speaking nations (ESC), at 10%.
Phân tích:
- Far fewer were those originating from countries that do not speak English (NESC), at 14%: Mệnh đề này so sánh tỷ lệ người lao động đến từ NESC thấp hơn so với tỷ lệ của người lao động khác.
- which was slightly higher than the figure for workers from English-speaking nations (ESC), at 10%: Mệnh đề này cung cấp một so sánh với mệnh đề trước đó, nói rằng tỷ lệ của người lao động đến từ ESC thấp hơn so với tỷ lệ của người lao động từ NESC.
3. Sử dụng mệnh đề quan hệ rút gọn
Ví dụ: Concerning the patterns of unemployment, that of individuals born in NESC fluctuated with a downward trend, decreasing from around 7% in 1993 to 3% in 2003.
Công thức: SV, which V -> chuyển thành dạng rút gọn: SV, V-ing
4. Sử dụng đa dạng các Cohesive devices
- In addition
- Regarding + Noun
- Concerning + Noun
Nếu có thời gian thì nhớ làm phần bài tập và tự mình viết một bài khác nha vì 'Practice makes perfect' mà nhỉ? DOL chúc các bạn học tốt!


