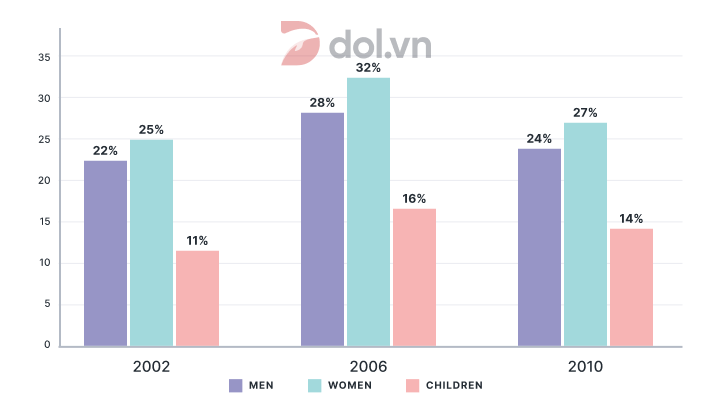
Percentage of the population in the UK who consumed fruit and vegetables
Đề thi IELTS Writing Task 1 ngày 24/02/2018 dạng Bar chart: The chart below shows the percentage of the population in the UK who consumed the recommended daily amount of fruit and vegetables in 2002, 2006 and 2010. Ở bài viết này DOL sẽ viết 1 sample IELTS Writing được 8.0 kèm với 1 số từ vựng và cấu trúc hay trong bài. Chúc các bạn học IELTS vui vẻ cùng dol.vn.
🚀 Đề bài

😵 Dàn ý
DOL sẽ miêu tả biểu đồ với 1 câu mở bài (Intro), 1 đoạn miêu tả tổng quát (Overview), và 2 đoạn thân bài miêu tả chi tiết (Detailed Description)
Mở bài: DOL sẽ paraphrase lại đề bài để giới thiệu lại đề bài cho người chấm
Miêu tả tổng quát: DOL sẽ chỉ ra các đặc điểm quan trọng, nổi bật nhất trong biểu đồ
Thân bài: Vì đây là dạng bài có số liệu thay đổi theo từng năm, ta sẽ tập trung vào sự tăng giảm của các số liệu
Body 1: Đầu tiên, DOL sẽ mô tả xu hướng tăng giảm chung của các hạng mục
Body 2: Tiếp đến, DOL sẽ đi vào chi tiết hơn và so sánh giữa những hạng mục.
- An increase across the board in the consumption of fruit and vegetables
- Uniformly fell
- Experienced the greatest growth at 7 percent, rising from 25% in 2002 to 32% in 2006 and fell by 5 percent in 2010
- Fell by 4 and 2 percent respectively between 2006 and 2010
📝 Bài mẫu
The chart indicates the proportion of the
As a
Between 2002 and 2006, it can be seen that the percentage of the UK population who consumed the recommended amount of fruit and vegetables
At the same time, the rate of growth for men and children were
(178 words)
📚 Vocabulary
✨ Bài tập Exercise
Mình cùng làm 2 bài tập sau đây để ôn lại các từ vựng và cấu trúc đã được dùng trong bài IELTS Writing Sample Essay nhé!
Exercise 1:
The figures for both A and B increased.
=> The figures for A and B increased
The figure for A and B increased by 10%. Meanwhile, the figure for C increased by 30%.
=> C experienced
The figure for A is not much higher than the figure for B
=> The figure for B is
The figure for A and B decreased by 10%. Meanwhile, the figure for C decreased by 30%.
=> The figure for C
The countries surveyed all witnessed a decrease in the number of cars sold in 1999.
=> The number of cars sold fell
Exercise 2:
Phần lớn người dân Anh thích uống trà.
=> The majority of the
Ít ai có thể tuân theo lượng trái cây và rau củ được khuyến nghị ăn hằng ngày.
=> Few people can abide by
Nhiều người đang đầu tư vào tiền ảo như một xu hướng chung.
=>
Trong cả 3 năm, tỷ lệ thất nghiệp đều dao động theo hướng giảm
=>
Hi! Đã có đáp án đề IELTS Writing Sample task 2 ngày 24/02/2018
Tổng hợp đề thi thật hay nhất tháng 02/2018.
Đón xem các bài văn mẫu Task 1 Writing IELTS khác trên DOL nữa nhé.
💡 Lời kết
Tới đây là hết rồi  Sau sample "The chart below shows the percentage of the population in the UK who consumed the recommended daily amount of fruit and vegetables in 2002, 2006 and 2010. " vừa rồi, DOL mong các bạn không chỉ nắm được cách trả lời cho dạng bài Bar chart, mà còn học được những từ vựng và cấu trúc hay để miêu tả các biểu đồ tương tự nhé.
Nếu có thời gian thì nhớ làm phần bài tập và tự mình viết một bài khác nha vì 'Practice makes perfect' mà nhỉ? DOL chúc các bạn học tốt! 


